Using SRTM Elevation Data
Introduction
This page explains and demonstrates with a working script how to obtain and read
Shuttle Radar Topography Mission SRTM
elevation data for use in an on-line map or similar geo-app.
Obtaining And Understanding SRTM Data
Before play there is work, getting the data. Although free, and tolerably well documented,
the number of small files that have to be downloaded, as opposed to just a few big ones, turns
obtaining SRTM data into something of a chore. Here are the most important links concerning
SRTM data:
SRTM data comes in several resolutions, but only the two most detailed are covered here, 1 arc
second2 (approximately 30m2 at the equator) and 3 arc second2
(~90m2). For both, the data is held in files called tiles, one for every
degree2 of longitude v latitude where there is some land
(areas that are all sea have no tiles). For the 1" data,
each tile contains 3601×3601 pixels, for the 3" data, each tile contains 1201×1201
pixels. Note in each case the extra row and column, which allow the rows and columns at the
edges of each tile to repeat the corresponding data from neighbouring tiles, thus making it easier
programmatically to scan from tile to tile. Each pixel consists of a two-byte binary value
in big-endian order (high byte followed by low byte), where -32768 (0x80,0x00)
represents a data void, any other value a genuine elevation relative to the WGS84/EGM96 geoid, for
which average global sea-level is approximately zero. Note also that within each tile the data
is stored in row-major order (x longitude within y latitude), and, like an image, from the top of
the tile to the bottom.
Obviously, you must download enough of the actual data to cover your area of interest, but, due to
the density of it, you will probably want to stop at that, as server space is usually a constraint.
UK Data
This section gives metadata for the SRTM tiles covering all of the British Isles, by which
is meant England, Scotland including all the remote islands, Wales, all of Ireland, The
Isle Of Man, and The Channel Islands, but excluding Rockall in tile N57W014:
Geographical Layout of SRTM Tiles Covering The British Isles
| | 11W | 10W | 9W | 8W | 7W | 6W | 5W | 4W | 3W | 2W | 1W | 0 | 1E | 2E | 3E |
|---|
| 60N* | | | | | | | | | • | • | • | | | | |
|---|
| 59N | | | | | • | • | • | • | • | • | | | | | |
|---|
| 58N | | | | • | • | • | • | • | • | | | | | | |
|---|
| 57N | | | • | • | • | • | • | • | • | • | | | | | |
|---|
| 56N | | | | • | • | • | • | • | • | | | | | | |
|---|
| 55N | | | • | • | • | • | • | • | • | • | | | | | |
|---|
| 54N | • | • | • | • | • | • | • | • | • | • | • | | | | |
|---|
| 53N | • | • | • | • | • | • | • | • | • | • | • | • | | | |
|---|
| 52N | • | • | • | • | • | • | • | • | • | • | • | • | • | | |
|---|
| 51N | • | • | • | • | | • | • | • | • | • | • | • | • | • | • |
|---|
| 50N | | | | | | • | • | • | • | • | • | • | • | • | • |
|---|
| 49N | | | | | • | • | | | • | • | • | • | • | • | • |
|---|
* SRTM data gives out at 60°N, which unfortunately for us in the UK is half-way
up The Shetlands. The 1 arc second data doesn't include 60N tiles at all (hence it
has 3 fewer), while the 3 arc second data includes them, but their data is incomplete and
incompletely processed to remove noise. See the section 60°N
below for further details.
SRTM BI Tile Map
60°N
There are no SRTM 1" tiles for latitude 60°N, while the 3" tiles have no valid
data north of latitude 60.385°N, and the sea south of that line contains noise
which in other tiles lying within the main SRTM band of coverage would have been
removed, and further this noise is also present in the top, shared, line of pixels
of those tiles from 59°N which have neighbours to the north at 60°N.
Thus, in the UK, the five land tiles (one is all sea) that cover The Shetlands are
affected: N59W002, N59W003, N60W001, N60W002, N60W003. For most purposes in
this area, raw SRTM data would be unusable, and alternative data, for example from
OS's Terrain 50,
must be used instead, either as from source, or else to construct replacement SRTM
tiles. To illustrate, the affected tiles are here converted into images
- that on the left is raw SRTM, that in the
middle is made from tiles created from Terrain 50, while that on the right compares
the two:


The two numbered sections shown below demonstrate what this does to profiles
returned by the script:
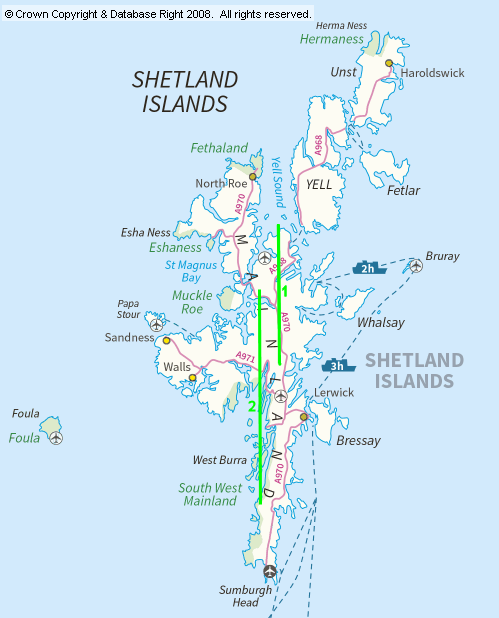
Section 1 between (60.25N,1.25W) and (60.5N,1.25W) demonstrates the biggest problem,
the total loss of data north of 60.385N. The first profile is from raw SRTM,
the second from tiles made from Terrain 50:


Section 2 between (60N,1.325W) and (60.385N,1.325W) demonstrates the second problem,
the noisy sea. Again, the first profile is from raw SRTM, the second from
tiles made from Terrain 50. Although after averaging the image doesn't show it
that clearly, the noise in the first gives points in the sea that are up to 8m
below sea-level:


Replacement Shetland tiles made from OS Terrain 50 data: SRTM3-OST50-Shetlands.zip
World Data
This table gives estimates of some of the metadata for the SRTM tiles covering the world,
but if you want to see coverage at a finer detail you will have to look at the
coverage map
(sorry, link now broken, can't find replacement).
SRTM World Tile Metadata
| | Tiles | Storage (GB) |
|---|
| 1 arc second2 (~30m2) | 3 arc second2 (~90m2) |
|---|
| Africa | 3250 | 78 | 9 |
|---|
| Australia | 1060 | 26 | 3 |
|---|
| Eurasia | 5876 | 142 | 16 |
|---|
| Islands | 141 | 3 | 0.4 |
|---|
| N America | 2412 | 58 | 6 |
|---|
| S America | 1807 | 44 | 5 |
|---|
| Total | 14546 | 351 | 39 |
|---|
| Zipped (est) | | 64 | 7 |
|---|
Example Script
This Python script is designed to run as a standard CGI script on a webserver.
By default, it uses SRTM 3" (90m2) tiles, but can be altered to use 1" (30m2) tiles by changing all references in the
following lines 163/167ff from SRTM3 to SRTM1:
				   # Relative path to tiles

				   Path	= SRTM3Path

				   # Unzipped file name template

				   FName	= SRTM3FileName

				   # Zipped file name template

				   ZName	= SRTM3ZipName

				   # Tile width (sample points)

				   X	= SRTM3Cols

				   # Tile height (sample points)

				   Y	= SRTM3Rows

				   # Angular resolution (radians)

				   ARes	= SRTM3AngRes
By default, either set of tiles, or the zips containing them, are expected to be in a sub-directory named SRTM
beneath that where the script is located. Debugging output is HTML5 compliant and requires two other files, an
HTML template, which can vary slightly from script to script and therefore
is named after the associated script to distinguish it from others, and an invariant CSS
stylesheet, by default named Minimal.css.
Obviously, these defaults can be changed to suit individual requirements, but the script (for the SRTM data and template paths)
and/or the template (for the stylesheet path) then must be edited accordingly.
The script is self-documented. Instructions for use are included as leading comments, and also are displayed in response to
errors in calling it.
If using this script, and scarcity of available server or web space so demands, the tiles
can be left zipped, as, when looking for a tile, the script will look first for an unzipped
version of it, but if that is not found it will then look for a zipped version. Inevitably
however, leaving the data in its original zips will slow things down a little.
A profile point is returned for each intermediate SRTM cell up to 100 (the empirically determined
maximum realistically displayable using a URL to the
Google Charts API to draw the profile). If a profile path crosses more than 100 cells, then
each of the 100 points returned is the average, or maximum if given the mx switch,
of the cells crossed by the path that are closest to that sample point -
that is, the profile returned is derived from all the cells it crosses, not just a sample
of them.
The profiles returned have been shown to follow a geodesic to within 1m up to about 70km, further
has not been tested.
Server CGI
It is beyond the scope of this article to document and support CGI. If required,
novices are referred to their webhost's online documentation and support for how to enable
Python CGI on their webservers. This article merely gives the basics for setting
up this CGI script. However, two points to note are to ensure that the
'shebang', the first commented line containing the path to the Python interpreter, is
correctly set, and that on Linux-hosted systems the execute attribute is set on the script
file, for example by using:
chmod +x <path to file>.
By default the script would normally be put in the /cgi-bin directory
off the site root. The default expected directory structure is therefore …
					/cgi-bin/SRTM.py

					/cgi-bin/SRTM/<all the SRTM data *.hgt or *.zip files>

					/Resources/Templates/SRTM.html

					/Resources/Styles/Minimal.css
CGI Python Script 'SRTM.py'
By default this is expected to be in the directory /cgi-bin off
site root. It lists as follows:
HTML Template 'SRTM.html'
By default this is expected to be in the directory /Resources/Templates off site root and
have the same base name as the Python script with an .html extension. It lists as follows:
CSS Stylesheet 'MinimalCSS'
By default this is expected to be in the directory /Resources/Styles off site root
and be called Minimal.css. It lists as follows:
Right-click this link and choose Save As for a zip of the three files
required for Server-side CGI:
SRTMServerCGI.zip
Displaying The Profile
Unfortunately, the only convenient way that I know of displaying a profile, the
Google Static Image Charts API,
has been deprecated since 2012. As per
this discussion
in their forum, they have made soothing noises, but these remain unofficial, and there is still no
definite word on any possible replacement. If it were to go, this wouldn't be the first time
that they've broken my work in this manner, and, as I don't suppose it will be the last, ideally
what is needed is some sort of standard library that can be installed on one's own site, but I
don't know of anything remotely comparable to the ease of just feeding Google a suitable URL.
However, at the time of writing in November 2021, it's still running(!), so here's how to use the
service. It really is as simple as taking the URL returned by either Python script, replacing
~Width~ and ~Height~ by suitable dimensions (pixels), ensuring
that the two when multiplied together come to less than Google's limit of 300,000, and then making
the result the src attribute of an img tag in your web-page.
Here's a demo, which, incidentally, also demonstrates the result of remaking the Shetland tiles
- previously this profile had an entirely spurious cliff in the
terrain at the point where the original SRTM data ended …
			<div id="ProfDiv"></div>

			<script>

				  <!--

				  var imgWidth	= 650;

				  var imgHeight	= 250;

				  var profData;


				  function callBack( data )

				    {

				    profData = data;

				    profData.url = profData.url.replace( "~Width~", "" + imgWidth + "" ).replace( "~Height~", "" + imgHeight + "" );

				    var img = document.createElement( "img" );

				    img.id = "ProfImg"

				    img.style.width = imgWidth + "px"

				    img.style.height = imgHeight + "px"

				    img.src = profData.url

				    document.getElementById("ProfDiv").appendChild( img );

				    }

				  //-->

			</script>

			<script src="http://example.com/cgi-bin/SRTM.py?x1=-1.317&y1=60.243&x2=-1.359&y2=60.394&cb=callBack&pr=true"></script>